Critical Particle Size Distribution for Cement using Laser Diffraction
“London Bridge is falling down….” Well not really, but only because the cement is still doing its good work! Producing high performance cement is directly related to maintaining a very specific Particle Size Distribution. Traditional size characterization methods include: Sieving using a 45μm sieve screen, Blaine Number measurement, and the Wagner turbidimeter measurement. These methods yield only a single number and are not sufficient to adequately characterize the crucial particle size distribution (PSD) of cement. Laser Diffraction is quickly becoming the method of choice as it yields a clear and accurate picture of the entire PSD.
Introduction
To say that the cement industry is big business may be the understatement of the decade! In 2014, the global cement production was approximately 4.2 billion metric tons1. Consider just the number of buildings, bridges, and roads that are built around the world every year using cement and you begin to get an idea of the magnitude of safety and quality considerations associated with its everyday use.
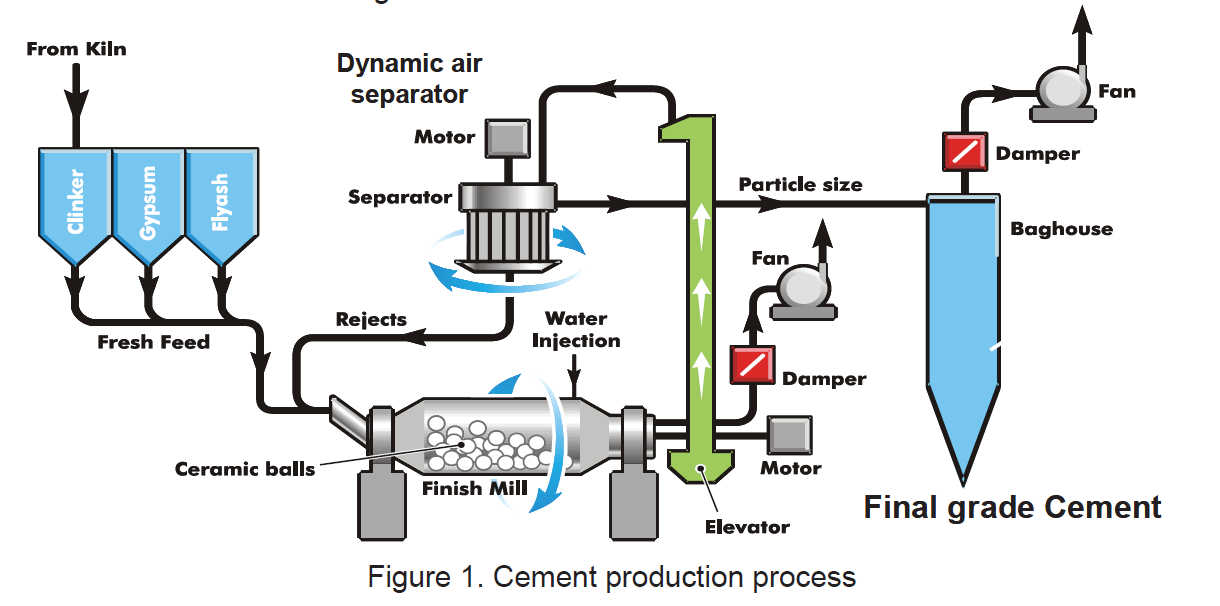
It is quite common to confuse cement with concrete, but in actuality, cement is a construction material used to produce concrete. There are many stages within the cement production process that require particle size characterization. Figure 1 below illustrates a typical cement production process. The most important point in the process to perform a Particle Size Distribution measurement is at the final product stage. The largest contribution to cement strength comes from particles smaller than 30μm, while particles smaller than 10μm contribute to the early curing stage and particles between 10-30μm have a larger impact at the later stage in the hardening process2. Generally speaking the larger the distribution percentage of particles between 3-30μm, the better the quality of the cement2. Experience tell us that the optimal size distribution is when 60-70% of particles in the overall distribution are within the range of 3-30μm and 10-20% are smaller than 3μm2. In the grinding process, overgrinding creates unnecessary costs; additionally it creates too many particles smaller than 3μm2. This phenomenon, in turn will produces too much heat during solidification, causes over sedimentation, which can further lead to quality issues like cracking. On the other hand, under-grinding will result in too many larger particles that in turn will prolong solidification time and can reduce overall strength.
Laser diffraction has emerged as the preferred sizing method in cement industry due to its simplicity and accuracy as compared to the more traditional methods. Current laser diffraction users in cement industry have witnessed good correlation between wet (alcohol) or dry analysis using the Beckman Coulter Dry Powder System (Tornado™) This is illustrated clearly in the “Measurement of Particle Size Distribution in Portland Cement Powder: Analysis of ASTM Round Robin Studies: technical paper.
Results and Conclusions
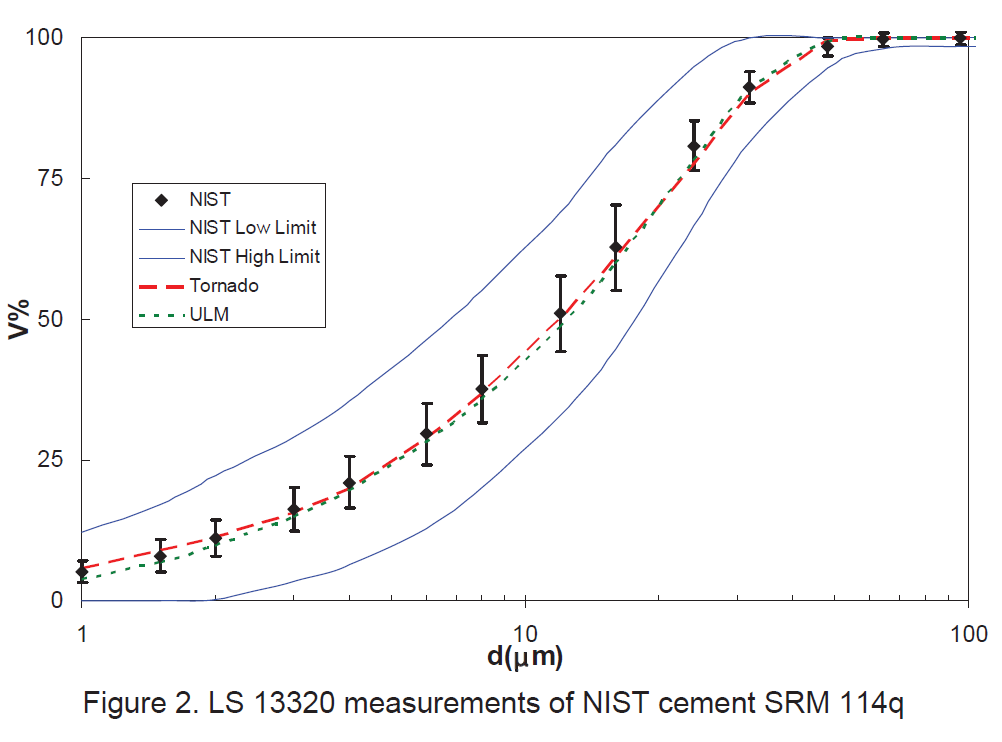
To standardize characterization of cement products using laser diffraction, NIST has issued a standard reference material (SRM) of Portland cement (NIST SRM 114q). In addition to listing the certified specific surface area values from Blaine and Wagner measurements and certified sieve residue values, the Particle Size Distribution of NIST SRM 114q is also specified using laser diffraction, both wet and dry analyses as the measurement techniques3. Beckman Coulter did not participate in the round robin analysis that determined the NIST SRM 114q size distribution. Fig. 2 details the analysis results of using a Beckman Coulter LS 13320 to characterize the NIST SRM 114q, both using both wet and dry methods. In the Certificate of Analysis, NIST specifies Simultaneous 95% Expanded Uncertainties for the Difference between a typical Laboratory and the Certified Value of SRM 114q3. The boundaries for the normal agreement are marked by two blue solid lines in Fig. 2 and the boundaries for the tighter agreement are marked by error bars at each data point in Fig. 2. As the graph clearly illustrates in Figure 2, both LS 13320 wet (Using the ULM module) and dry (using the Tornado Dry Powder System module) analyses resulted in excellent agreement, all well within the tighter limits, required by the NIST certification2.
References
- US and World Cement Production 2014
Retrieved from http://www.statista.com/statistics/219343/cement-production-worldwide/ - Guillermo Smart, AN-12784A BCPCS009LE LS-Cement
- Chiara F. Ferraris, Vincent A. Hackley, and Ana Ivelisse Avil´es Measurement of Particle Size Distribution in Portland Cement Powder: Analysis of ASTM Round Robin Studies.
Retrieved from http://fire.nist.gov/bfrlpubs/build04/PDF/b04040.pdf
Author

Bill F. Bars is a Senior Application Scientist for Beckman Coulter Life Sciences in Grants Pass, Oregon, USA. He has created and developed many of the liquid systems production processes and procedural tools for the BEC Particle Counting Business Units products. These products include: HIAC PODS, HIAC GlyCount, 9703+, 8011+, ROC, and HRLD Sensors. He received his Electronics Engineering degree from DeVry Institute of Technology. He has worked for Beckman Coulter Life Sciences for 19 years in a multitude of engineering capacities ranging from Metrology to Technical Service Training and Application Support.
Email Bill F. Bars at [email protected]
Beckman Coulter Life Sciences
Particle Counting and Characterization
481 California Ave
Grants Pass, OR 97526 USA
